OD measurements with two photodiodes?

Summary
I’m looking for some advice on how to properly do calibrations with two variables.

Background
I’m trying to integrate hardware configuration for OD measurements to improve the consistency and dynamic range of the sensors. I figured adding a different sensor at a different LED-diode offset would do the trick. I did a simple, rough experiment and collected measurements off of 90 degree and 135 degree offsets with increasing amount of milk (to approximate scattering from cells).

Heres the plot:

Question
I was thinking of using a 3D fit to capture the relationship between the two curves and OD. But I figured, that might not work ideally because of the complexity of the shape and the potential for over fitting. Can anyone recommend a better way to do this?

Looking back at the NBT supplement, fig S6, OD vs photodiode reading for milk was not the same as OD vs photodiode for yeast cells. Cells scattered more than milk, with the same OD. Do you remember if this was done for the same vial, or is it a vial to vial difference?

Just worried about optimizing too much for milk. Might be good for us to test quantity vs OD vs photodiode readings for: milk, grocery store yeast, and lab yeast culture. Let me know what photodiode layouts make the most sense to test.

And re: 3D fit, I don’t think it’d be too bad if both were monotonic, but I worry about trying to fit on that peak. I’ll think some more about whether it could be done piecewise or do a weighted average using the magnitude of the slope as a confidence parameter.

Just worried about optimizing too much for milk.

I think the two behave differently but is a pretty good approximation for each. You’re right they will be pretty different, cell to cell also. But I am pretty sure they will have the same approximate behavior.

weighted average using the magnitude of the slope as a confidence parameter.

Yea was thinking some piece wise fitting would be ideal, with an automated way of segmenting the function up.

Curves look like this on a 3d scatter:

Is there a way to separately plot residuals for each OD point? Its hard to estimate the quality of fit on the 3d plot.

@cmancuso and I finally got around to doing the calibration with two photodiodes. I rewrote the code on the server, electron GUI, and the calibration script to simplify some of the data processing and allow us to simultaneously calibrate both photodiodes at once.

Device Settings

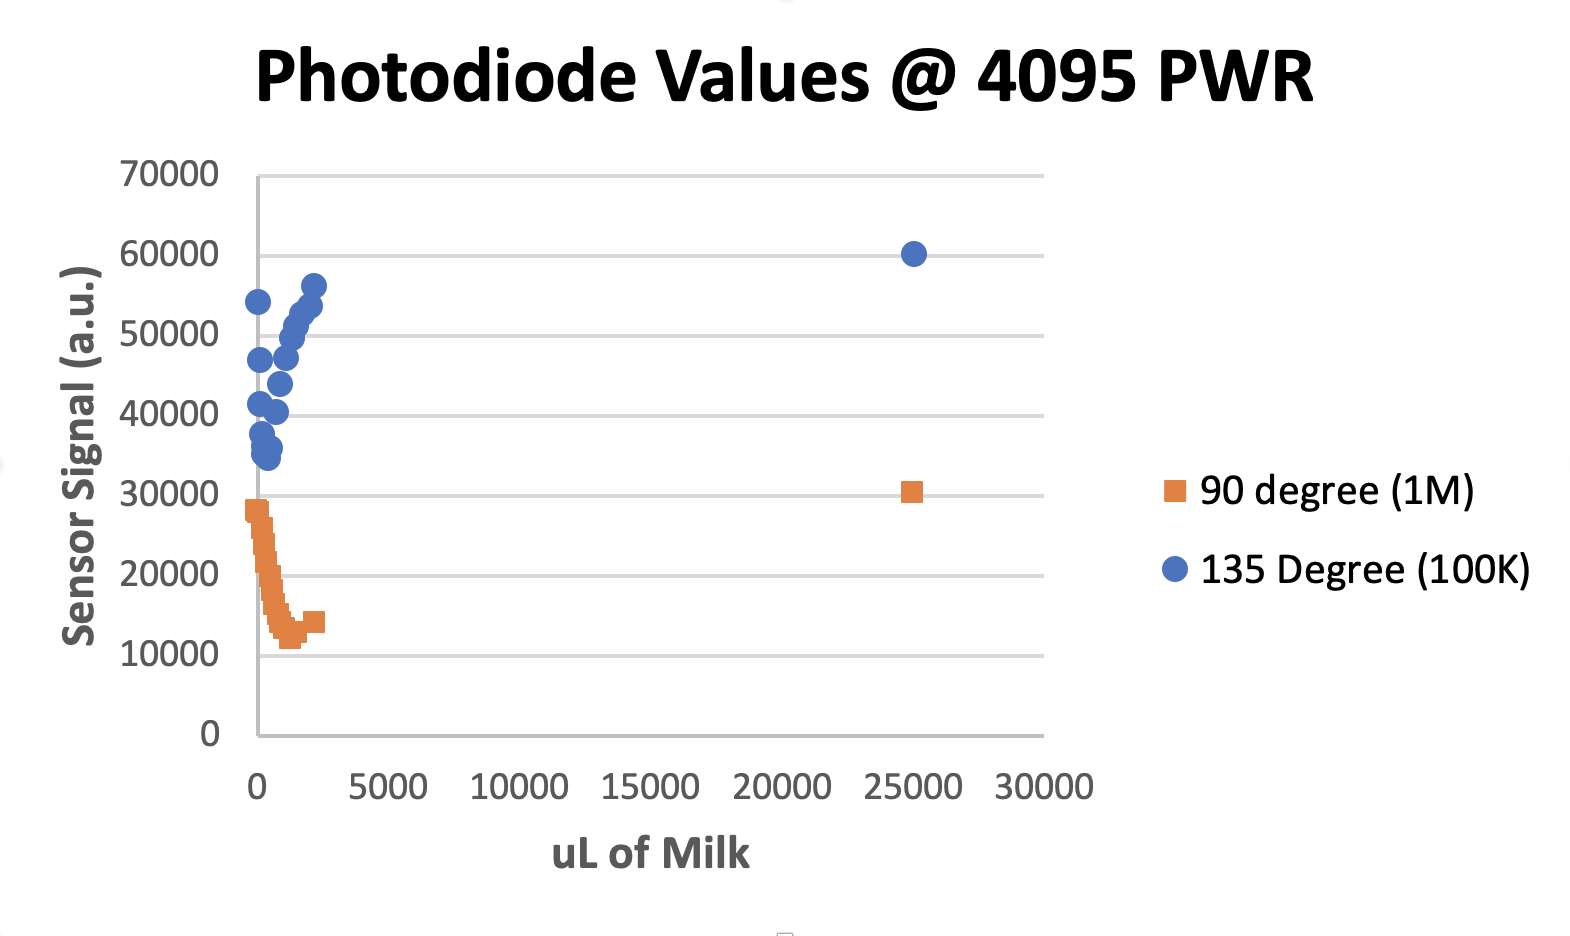
Resistor Pack OD90: 1M
Resistor Pack OD135: 100K
OD90 Averaging: 1000
OD135 Averaging: 1000
LED Power: 4095 (full power)

Calibration Graphs

OD90

OD135

I also wrote code to generate 3D subplots, but they weren’t very informative to look at - I think looking at the two individual sets of calibration curves provides more insight to the data. I put some information at the bottom in anyone is interested.

Thoughts
@cmancuso and I discussed this for a while, and please anyone feel free to add any comments or thoughts you might have from looking at these graphs.

The first thing that was nice to see is that the E. Coli curves match the curves @bgwong provided using milk. For 135 degrees, there is a steep increase in signal (decrease in ADC value) initially as the cells or milk scatter the light into the PD, followed by a steady decline of signal as they become more dense and block out the light completely. The 90 degree curves show a similar trend, but are more stretched out as the angle is much more intense.

We noticed that curves that were particularly bad for the 90 degree at the low OD range (like vials 0, 2, and 14) were excellent at low OD for the 135 degree PD. Vials that the 90 degree PD is able to measure at low ODs (like vial 8) seem to have 135 degree values that are already being pushed into the regime where the signal is decreasing as density increases, meaning the scattering signal is saturated for that angle.

@bgwong can correct me if I get some of this incorrect, but from my understanding, increasing the value of the resistor pack means that less current (or a smaller signal) is able to generate a larger voltage drop on the ADC (up to 3.3 V - 0.6 V dropped across the diode). This means that you can get really good signal from less photons hitting the detector. This is why the NBT paper used a larger resistor pack (10M) with a lower LED power (2125). The problem is that you can saturate the signal rather quickly as the voltage will not increase over the bias voltage on the PD minus the drop over the PD. So in the new setups we’ve been trying, we use smaller resistor packs with more LED to try and get a larger dynamic range.I think now we are seeing not the sensor saturating, but the light scattering from the cells saturating, which is kind of cool. By having the dual angle/resistor pack, it’s possible to get really nice data from lower OD cultures via the 135 degree photodiode, while still being able to measure higher ODs with the 90 degree and shift in the 135 from sensing scattering to being blocked out.

Going forward
There are a few options here that anyone can do with their units. The first is to go the NBT route - tune the LED power and resistor pack to give a range that works for whatever system being studied. A resistor pack of 10M and LED power of 2125 at 135 degrees gives pretty good results for most vials from OD 0.0 0.7, give or take a few tenths depending variability in the LED, PD, and their relative positions in the 3d printed part. You could also use the 90 degree PD if you’d like to explore higher ODs, but you might lose some of the lower end accuracy, which might not matter too much depending on the application.

@cmancuso and I also discussed possibly using both PDs in conjunction to determine the OD of the culture. The simplest way to do this would be to select the curve that has the steepest slope at the value being measured. This could introduce noisy measurements at points where the slopes are nearly identical or switching between the curves if they do not exactly align. There could be a way to weight the predicted OD from each curve based on their relative slopes, but we’d need to test this out to see how it would work in practice.

Also, as @bgwong mentioned we could use a 3d surface fit, but again this would need to be tested out to really see if it will work. I uploaded my calibration data here. You need to use the new version of the calibration script here. I’ll update the link when it’s merged to the main branch. The script takes an argument --3d if you want to plot in 3d using both 135 and 90 degree measurements.

I’m really not sure about the feasibility of using a 3d surface fit for calibrations, I think there might be a clever way to maybe using some machine learning methods to use both the 90 and 135 data to determine OD. Maybe @mgalardini could chime in here.

Hi all! I love this data, and while I can be of little help in understanding the electronics side of things I can at least try to see if we can come up with a single conversion from sensor measurements to actual OD.

Something that I did not understand is what is going on with vials 4, 5, 8, 9, 10 and 15, where the signal to OD relationship is kind of inverted. Would it make sense to ignore the data points beyond OD ~0.5?

@mgalardini It’s actually a change in regime from detecting scattering to the cells being dense enough to start blocking out the light completely to the detector. At least that’s what I think is going on, and it also correlates with what @bgwong sees with milk in the original post.

@mgalardini I think @heinsz is correct. The 90 degree signal is increased with back scatter so eventually that signal will go down also but at a much higher density. See below of the extended curves, to much higher densities of milk:

So @mgalardini , back to your question. I think its actually beneficial to have that data there because it would let us measure much higher density ranges, based on that 90 degree and 135 degree signal get blocked in different ways. If we can signal from both sensors, I think we can reach >5 OD, if not higher.

Overall, I think this would be a lot better once we figure out what is going on with vials 8, 9, 10, 15. Maybe changing the 3D printed part for more consistency is necessary. Or do you think it’s the electronics?

@bgwong I think it’s probably both. The resistor packs we use have 2% tolerance, and I don’t know the tolerance of the other parts (LED/PD) but if you’re unlucky it could add up to be quite a difference between channels/eVOLVERs just from parts alone. Not sure what the affects of position would be - maybe that is something we should try to play around with in the future using 1 vial, see how moving the parts around changes the calibrations.

@bgwong @mgalardini and I played with the 3d calibration idea a little bit more and actually got some interesting results. Here is the same data from our experiment plotted in 3d with a surface fit. The equation we used is the following:

z = c0 + c1x + c2y + c3x^2 + c4xy + c5*y^2

All of our R-squared values are about 0.99, and the RMSE is under .02 for almost every vial - some are under.

@mgalardini generated some plots where we cut off one of the axes and show the surface as a line along the two dimension. Could you upload those here please?

We’re doing a few experiments today and tomorrow using these fits, capturing all of the raw data. We’ll plot it all out over the next few days and report our results

1 Like

Here’s the plot for od90:

And the one for od135:

y-axis is the same for all subplots.

1 Like

This looks really awesome guys! We should do it with different cell types just to confirm it will generally work. I’m curious what will happen when the cells are going under antibiotic stress also.