Hi everyone!
We have a couple of new developments in software/documentation that I would like to outline here.
eVOLVER Documentation Wiki
First, I’d like to announce that we now have an official open-source eVOLVER wiki (eVOLVER Documentation Wiki | eVOLVER)! It’s still under construction, but we’re hoping for the wiki to be home for guides and general documentation about hardware/software structure and usage. We’re going to keep editing private while we finish up some of the main pages, but will eventually open it up so that anyone can contribute. The wiki documents are all synced to a Github repository (GitHub - khalillab/evolver-docs: Gitbook documentation for eVOLVER), so going forward pull requests can be made there if you would like to contribute!

If you find any errors or have anything you’d like to see added/prioritized, please let us know here in the forum.
Software Release 2.0.0
Second, we recently released version 2.0.0 of the eVOLVER software with a bunch of new of upgrades/features! This release introduces some major changes to the GUI and DPU, as well as handling some minor bug fixes throughout all of the repos.
You can download the latest release on each individual Github repo by clicking the releases link on the right side of the page for a given repo.

Updating existing systems
If you want to use these new features (briefly described below), you will need to upgrade the server, dpu, and GUI all together. You should not need to update the Arduino microcontrollers. Make sure you do step 4 for the GUI to function properly.
We are also now recommending venv for installing the DPU. Instructions on the wiki outline the process.
Lastly, if you update, you must add a default pump_cal to the calibrations.json file or else the setup page will have issues running. Please see the example file on github - you can copy the following into the beginning of your own calibrations.json file after the initial opening bracket.
{"name": "pumpcal_20210217", "calibrationType": "pump", "timeCollected": 1613602540591, "measuredData": [10, 10, 10, 10, 10, 10, 10, 10,10, 10, 10, 10, 10, 10, 10, 10, 10, 10, 10, 10, 10, 10, 10, 10, 10, 10, 10, 10, 10, 10, 10, 10, 10, 10, 10, 10, 10, 10, 10, 10, 10, 10, 10, 10, 10, 10, 10, 10], "fits": [{"name": "pumpcal_20210217", "type": "constant", "timeFit": 1613602540591, "active": true, "params": ["pump"], "coefficients": [0.75, 0.75, 0.75, 0.75, 0.75, 0.75, 0.75, 0.75, 0.75, 0.75, 0.75, 0.75, 0.75, 0.75, 0.75, 0.75, 0.75, 0.75, 0.75, 0.75, 0.75, 0.75, 0.75, 0.75, 0.75, 0.75, 0.75, 0.75, 0.75, 0.75, 0.75, 0.75, "0.75", "0.75", "0.75", "0.75", "0.75", "0.75", "0.75", "0.75", "0.75", "0.75", "0.75", "0.75", "0.75", "0.75", "0.75", "0.75"]}], "raw": [{"param": "pump", "vialData": [["7.5"], ["7.5"], ["7.5"], ["7.5"], ["7.5"], ["7.5"], ["7.5"], ["7.5"], ["7.5"], ["7.5"], ["7.5"], ["7.5"], ["7.5"], ["7.5"], ["7.5"], ["7.5"], ["7.5"], ["7.5"], ["7.5"], ["7.5"], ["7.5"], ["7.5"], ["7.5"], ["7.5"], ["7.5"], ["7.5"], ["7.5"], ["7.5"], ["7.5"], ["7.5"], ["7.5"], ["7.5"], ["7.5"], ["7.5"], ["7.5"], ["7.5"], ["7.5"], ["7.5"], ["7.5"], ["7.5"], ["7.5"], ["7.5"], ["7.5"], ["7.5"], ["7.5"], ["7.5"], ["7.5"], ["7.5"]]}]}
If you have other questions about updating please ask them here.
GUI updates
We improved the calibration process and added a new way to edit, run, and view data from your experiments all in the GUI.
Calibrations
First, we made it such that the GUI will now automatically make fits for you data and save those on the server. This means you no longer need to run the python script calibrate.py after you do your calibrations in the GUI!
Second, data from your calibrations can be viewed in real time at any point during the calibration by clicking the VIEW COLLECTED DATA button on the bottom left of the calibration pages. This will bring up a set of graphs for all of the vials displaying all data collected up that point in the calibration process, allowing you to detect problems before going through the entire process.
Lastly, pump calibrations are now integrated with the GUI/server. To do a pump calibration, first fill the tubing for the pumps you’d like to calibrate with water. Next, select the vials you’d like to calibrate, put the tubing for those pumps into the vials, run the pumps, then note the amount of liquid pumped in the application. You no longer need a pump_cal.txt for the DPU - the calibrations will be acquired similarly to the temp/od cals in json format from the server. A guide for this process will be on the wiki soon.
Experiment Editor Page
You can now manage your experiments within the GUI from the experiment manger page. This works similarly to how it was described in the JoVE paper in 2019, but the differences are highlighted on the wiki guide.

If you set the experiment directory to be a dropbox or google drive mounted location (by clicking the pen button at the top of the experiment manager page) you can easily share data between collaborators and view your data remotely in real-time by selecting that directory on a GUI running on a different computer.
Experiment Editor Page
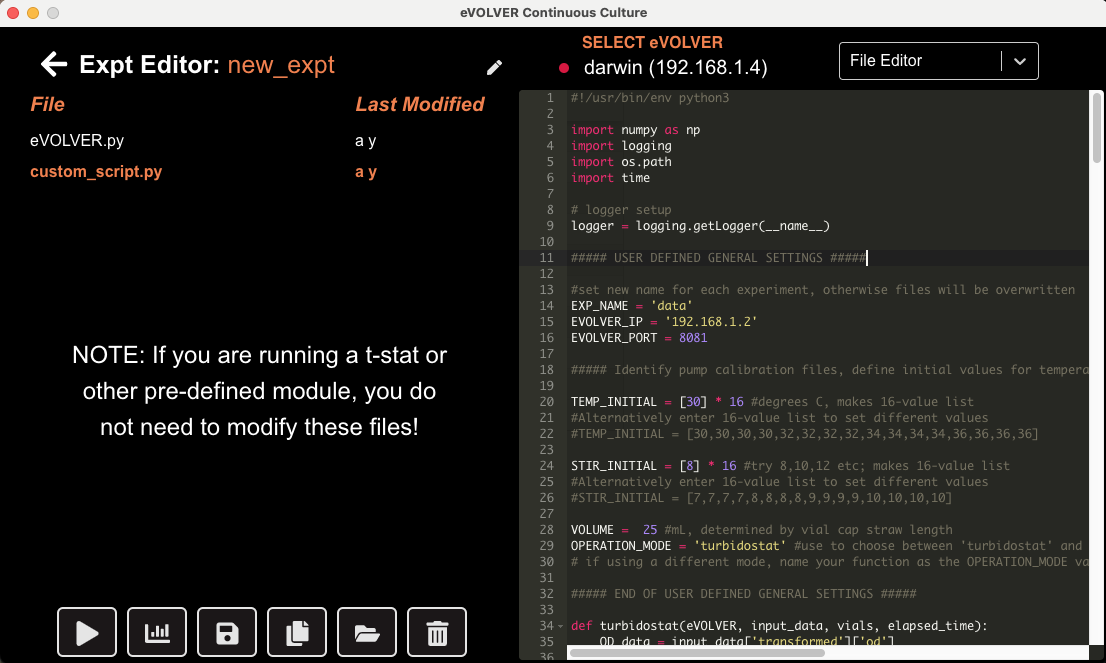
You can also now edit experiments directly within the GUI. Click the pen icon in the row on the experiment manager table to bring up this page. There are three pre-defined experiment editor pages you can use for basic turbidostat, chemostat, or growth curve experiments which you can select in the top right drop down. The page also allows you do pick the eVOLVER you’d like to run on (just be sure to change the calibrations if you need to on the setup page before running) and modify the experiment name. Select vials similarly to the setup page and apply experimental parameters via the sliders and buttons on the left side of the page. When you finish setting up everything, click Save Expt. at the bottom right of the page (NOTE: the floppy disk icon is meant only for the file editor described below. We’ll make this more intuitive in a future release.)

We also allow you to directly modify the eVOLER python scripts within the application if you’d like to, but please note doing this will lock the experiment out of the predefined functions. You should not need to modify the files normally unless you have something more custom you’d like to do. The save icon on the bottom left is used for saving the files.
You can also bring up a file browser to interact with the files directly if you need to by click the folder icon on the bottom of the page.
After you finish setting up the experiment, you can click the play icon on the experiment editor or manager page to start the experiment!
If you’d like to modify a running experiment, stop the experiment (click the square button on either the manager/editor/data visualization page), make any desired changes, and restart the experiment. The experiment will continue appending data to the files where it left off.
Data Visualization Page
Clicking the graphs icon on the experiment editor or manager page will bring up the data visualization page. On this page you can view OD and Temp values for all vials, as well as view the experiment logs. You can bring up individual plots by clicking the vial number on the right, and select data ranges either using the radio buttons or by moving the sliders on the individual plot. If you move the slider, the values will be persisted if you go back to viewing all vials.


If you click the DOWNLOAD button, you can save a copy of the experiment/data to any desired location on your computer.
Note that if you are viewing the data remotely, you should not try to use the play/stop buttons, they will not work and could cause problems with your data. We will make this more robust in a future update.
NOTE: If you close the GUI, your experiments will continue to run in the background on your computer. You can reopen the app and it will detect this experiment and allow you to interact with it as normal. There will be popups when this occurs letting you make decisions about how to handle the experiments.
DPU Updates
The DPU has been updated to accommodate the GUI managing running experiments. For the most part it is the same, but there main difference you will notice is that the IP is no longer supplied as a constant variable within custom_script.py - it is instead provided now on the command line. You can still run your experiments as normal on the command line if you don’t want to use the GUI. If you run them on the command line, you can still view your data through the application by pointing the GUI to the experiments directory where the experiment is running. Just make sure you keep the experiment name as data if you want to use this feature. To maintain backwards compatibility with the old cloud evolution django webapp for viewing data we left this as a variable that can be modified.
There is a new file nbstreamreader.py that is for receiving messages from the GUI while the DPU is running. It currently is only for receiving stop messages to stop pumps before quitting, but it could be used in the future for more interesting applications.
Server Updates
There are minimal updates here except for some bug fixes. Please see the note about the pump calibration up above.
Final thoughts
I’m hoping that we maintain a faster development cycle going forward - I know it’s been a while since our last release. If you find any problems or bugs in the new software do not hesitate to let us know here on the forum so we can get them fixed as soon as possible!
I would also like to acknowledge and thank @ezirayw, @bgwong, @Nate_Borders, and @danhart for their help with the software and in working on the wiki.

